The current INFORMS blogging challenge/theme is about "O.R. and politics". It reminded me of a student project a great many years ago. It was never suitable for a research paper write-up, but a blog is an appropriate place to recount what happened.
The city had expanded, and a large housing estate had been built. Part of the development was a new primary school. However, before the estate was complete, the school became overcrowded. It was too small. Not much could be done to provide more space. The local politicians were embarrassed and the local media were not slow to blame them. The student (B) and I were asked to help the council officers make better decisions in the future.
So we interviewed people, read literature, and did our best to become familiar with aspects of planning. We quickly realised that the whole mess was multi-criteria, and many criteria were non-numerical. One of the attributes of O.R. should be the ability to cut through messes. For simplicity, here, we reduced the problem to a two way table. One dimension was the forecast demand, reduced to “Low”, “Medium”, “High” and the size of school “None”, “Small”, “Medium”, “Large”. In each of the twelve cells we wrote down aspects of the consequence of the two dimensions, and then iterated through meetings in which stake-holders could contribute their ideas. So the table of twelve cells became a tool for thinking with for planners and decision-makers. It could be – and was – used in other new developments in the city and region. Nothing high-tech, but we had helped to make the mess less messy. B went on to a career in O.R. and other messy problems.
Among the gems that we learnt along the way were the following:
(1) It takes about five years from initial ideas to opening a school, so the children who will use the school are being born at about the time of those initial ideas;
(2) Families with pre-school children are much more mobile than others, so it is not possible to forecast demand by local surveys of families;
(3) The forecasts made in the past had gone awry because of world-wide economic upheaval;
Showing posts with label measurement. Show all posts
Showing posts with label measurement. Show all posts
Tuesday, 11 January 2011
Monday, 13 September 2010
Fair Exchange in 1948
In 1948, the railways in the United Kingdom were nationalised by the then government. There were four (the "Big Four") railway companies operating in the country, and they acted independently of each other for many purposes. So, after nationalisation, British Railways had a fleet of steam engines from four different stables. Because of the war, many of these locomotives were past their best. Each of the companies had its own locomotive designers, and over the years, each company had developed its own style of locomotive design, to meet the topography of the region, and the objectives of its railway service.
The new management realised that this might be inefficient, so commissioned trials to help find a range of standard steam locomotives. So they mixed and matched, taking locomotives from one stable and running them on the other types of track. The aim was to find the "best".
Now, one of the first questions one asks in O.R. is "What do you mean by best?" According to the history of the 1948 Exchange, nobody really thought of this. Obviously it is a multi-criteria problem, and there are several types of locomotive to be identified and designed. But, even for one type, such as hauling express trains, there are various criteria to consider. The Wikipedia article about the exchange comments:
the testing had little scientific rigour, and political influence meant that LMS practice was largely followed by the new standard designs regardless.
So the optimum was found, not so much by scientific analysis, but by politics. O.R. scientists, beware!
And a little footnote from the book which started me on this story, Amazing and Extraordinary Railway Facts by Julian Holland:
One eminent railway historian was shocked that the Stanier Black 5 type had performed badly; it appeared that the driver and fireman had tried to minimise the fuel consumption during the trial.
So, of course if your staff don't understand the aim of the experiment, they may interpret it in the wrong way. Beware!

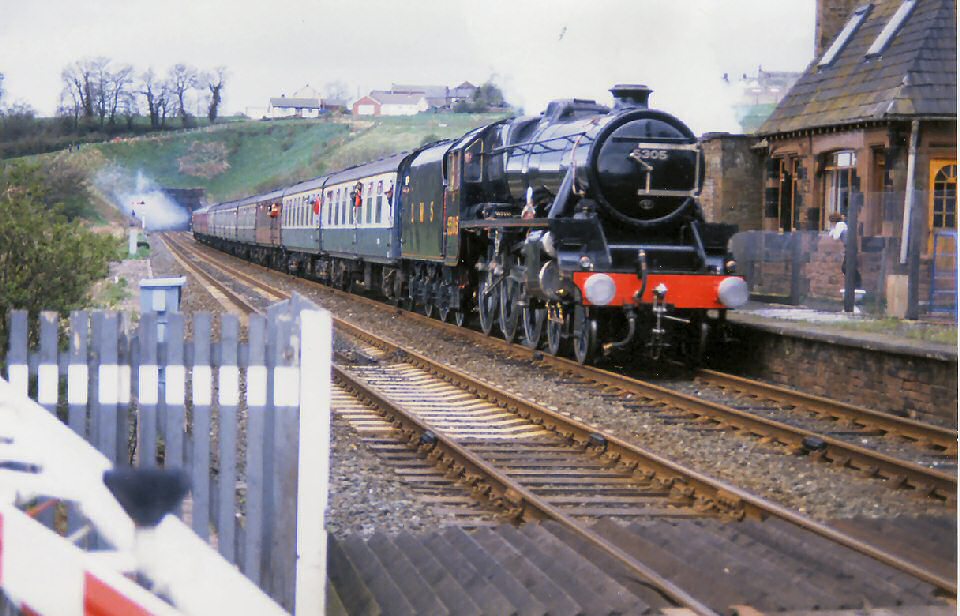
A Stanier Black 5
The new management realised that this might be inefficient, so commissioned trials to help find a range of standard steam locomotives. So they mixed and matched, taking locomotives from one stable and running them on the other types of track. The aim was to find the "best".
Now, one of the first questions one asks in O.R. is "What do you mean by best?" According to the history of the 1948 Exchange, nobody really thought of this. Obviously it is a multi-criteria problem, and there are several types of locomotive to be identified and designed. But, even for one type, such as hauling express trains, there are various criteria to consider. The Wikipedia article about the exchange comments:
the testing had little scientific rigour, and political influence meant that LMS practice was largely followed by the new standard designs regardless.
So the optimum was found, not so much by scientific analysis, but by politics. O.R. scientists, beware!
And a little footnote from the book which started me on this story, Amazing and Extraordinary Railway Facts by Julian Holland:
One eminent railway historian was shocked that the Stanier Black 5 type had performed badly; it appeared that the driver and fireman had tried to minimise the fuel consumption during the trial.
So, of course if your staff don't understand the aim of the experiment, they may interpret it in the wrong way. Beware!
A Stanier Black 5
Wednesday, 27 May 2009
Measuring and comparing risks
Yesterday's newspaper had a feature about the risks associated with competing in a triathlon. A study presented to the American College of Cardiology Conference had reported that the death rate among competitors in triathlons was about twice that of competitors in marathons. (1.5 per 100,000 competitors compared with 0.8). That news report closed with the comment from one of the staff at my university that the idea that exercise is dangerous should be compared with sedentary life.
O.R. professionals ought to be able to see through the nonsense of the report and the comment. What are you trying to measure? How do you compare one activity with another? The death rate in the U.K. is about 1 per 100 per year, or 1000 per 100,000. Dividing that by 365 and then by 8, we get 0.35 per 100,000 in a three hour period. So the death rate in marathons (which last 3 to 4 hours for the majority of competitors) is about twice the national death rate. But the rate varies with age and gender and lifestyle. However, the national death rate includes deaths from accidents, which generally affect the more mobile sectors of the population. The people who die outside marathons include the terminally ill, the aged, etc. -- not the sort of people who compete in endurance sport. They probably have an extremely small chance of dying of natural causes in the next three hours. But they have that risk of accident. So we can conclude that the person who decides to enter an endurance sport increases their chance of dying during that event. But the actual risk is still very small; the half-marathon that I mentioned earlier has about 2500 competitors. If the figures for marathons and half-marathons are comparable, there will be an avaerage of one death every fifty years.
But, even more seriously, the reports about when the deaths occur in triathlons, as all but one of those recorded were in the swimming sport, should alert organisers to warn the competitors about the risks of not being prepared for a long, frantic swim in water that is colder than in heated swimming pools.
As for me, I shall cycle home today. My risk of an accident is about 1 in 4000 based on an average of 1 accidents per ten thousand person miles (here) and a journey of 2.5 miles home. (This is about my experience -- I have been hospitalised three times in 40 years of cycling, with an average annual mileage of a little over 1000 miles, giving 3 accidents in 40,000 miles.)
Tuesday, 24 March 2009
Precisely how do you measure?
I am reading a book with an intriguing title. "How round is your circle?" which discusses measurement and engineering mathematics (among much else). The authors point out that experimental science progressed in step with the ability to make accurate measurements. This was especially the case in astronomy, which in turn led to Newton's laws and the law of gravity being demonstrated.
I have mentioned my concern about over-precision in measurement in other blogs. Recently, Exeter, where I live, has erected signposts for the benefit of pedestrians. Distances are measured in time. This is a method often used, but is prone to abuse and error. Jokes abound about the hotel that is "two minutes from the beach" (provided you are an Olympic runner and there is no traffic in the streets), or the house for sale that is "ten minutes drive from the city centre" (when there is no other traffic, you ignore speed limits and stop signs). The problem with some of Exeter's distances is that they are too precise. One reads 19 minutes to the university campus, which is so large that it takes over 20 to cross it. There is a case for defining a set of walking times that can be used, to allow for the variation in pace, and the problem of where do you measure to. What do you think the set should be: 1,2,3,4,5,8,10,15,20,25,30,40?
I have mentioned my concern about over-precision in measurement in other blogs. Recently, Exeter, where I live, has erected signposts for the benefit of pedestrians. Distances are measured in time. This is a method often used, but is prone to abuse and error. Jokes abound about the hotel that is "two minutes from the beach" (provided you are an Olympic runner and there is no traffic in the streets), or the house for sale that is "ten minutes drive from the city centre" (when there is no other traffic, you ignore speed limits and stop signs). The problem with some of Exeter's distances is that they are too precise. One reads 19 minutes to the university campus, which is so large that it takes over 20 to cross it. There is a case for defining a set of walking times that can be used, to allow for the variation in pace, and the problem of where do you measure to. What do you think the set should be: 1,2,3,4,5,8,10,15,20,25,30,40?
Tuesday, 3 March 2009
Measuring the difficult
Sometimes in operational research it becomes necessary to measure something which is difficult. From time to time, the O.R. literature reports on studies which fall in this category, and it is fascinating to see how the profession tackles the problem of measuring the difficult. Statisticians have techniques for surveys which ask extremely sensitive questions.
I have just come across a paper which falls in this "Fascinating how the research measured the difficult". How do you measure people's journeys in an elevator? Here's the citation:
@ARTICLE{Fascinating,
AUTHOR ="Kiyoshi Yoneda",
TITLE ="Elevator Trip Distribution for Inconsistent Passenger Input-Output Data",
JOURNAL ="Decision Making in Manufacturing and Services",
YEAR = "2007",
volume = "1",
number = "1/2",
pages = "175--190",
note = "Fukuoka University, Fukuoka, 814-0180 JAPAN",
abstract = "Accurate traffic data are the basis for group control of elevators and its performance evaluation by trace driven simulation. The present practice estimates a time series of inter-floor passenger traffic based on commonly available elevator sensor data. The method demands that the sensor data be transformed into sets of passenger input-output data which are consistent in the sense that the transportation preserves the number of passengers. Since observation involves various behavioral assumptions, which may actually be violated, as well as measurement errors, it has been necessary to apply data adjustment procedures to secure the consistency. This paper proposes an alternative algorithm which reconstructs elevator passenger origin-destination tables from inconsistent passenger input-output data sets, thus eliminating the ad hoc data adjustment.",
file = F
}
One of my colleagues was involved in a study of what coins people would put into a slot machine that gave change, in order to determine what mix of change the machine should have. He started with a survey of the students we teach, and then asked them to repeat the survey with ten friends.
On the subject of elevators, I liked "10 Clever Elevator Ads".
Monday, 16 June 2008
Multicriteria cities
According to a survey that seems to have been flashed around the world like a viral email, Copenhagen is the "best" place to live in 2008. The magazine "Monocle" (a "Lifestyle magazine" which is not in the journals abstracted for IAOR) took measurement on several criteria, weighted them and came up with a ranking which placed the Danish capital at number 1.
Operational researchers are familiar with problems of multiple criteria measurement. The cynical O.R. person will mutter about adding apples to oranges and trying to work out what the result is. Everyone will have their views on the best place to live, and what makes it so good. And that list will almost certainly not coincide exactly with the criteria used by the magazine. Let me admit that I like Copenhagen, perhaps because my late friend Ellen had a flat which was ten minutes walk from the gates of Tivoli Gardens, and so could hardly have been more convenient for visiting the place. Even without that personal experience, it is a very pleasant city, but my criteria would not have included (for instance) Monocle's number of international flights from the city airport, nor the ease of buying drinks at 1a.m..
So, seeing such analysis of multiple criteria optimisation, the O.R. person ought to reflect on how difficult it is to measure the "hard to measure" and on how to work with clients and decision-makers when some of the consequences of choice are determined by aesthetic and qualitative scales.
Subscribe to:
Posts (Atom)