A new journal of O.R. has been launched, and has now published two issues. This is the Iranian Journal of Operations Research, published from Tehran. On first glance, its contents are generally theoretical, but that is true of many other O.R. related journals. The first abstracts from it will appear in IAOR in early 2010.
What is not clear is hows strong the fledgling O.R. socety is in Iran. The web address suggests that there may be plans for it to develop, but the English version is limited at present.
Monday, 14 December 2009
Monday, 30 November 2009
The best statistic I have heard for a long time
BBC Radio 4 has a flagship news and current affairs programme every weekday morning called "Today". Following one interviewer's comment, the presenter commented "The best statistic I have heard for a long time". He then paused and added words to the effect that the statistic was not good news, but had been presented in a clear way so that the meaning was easy to understand. It strikes me that those of us who work with mathematical models could learn from this example.
The interview had been about the social deprivation of parts of the east of London, and the comment was made: "for every tube stop on the Jubilee line [on London Underground] going east, from Westminster to Canning Town, life expectancy decreases by one year". It is not good news. But the information is conveyed in a way that is clear, simple and easy to assimilate. It is not cause and effect. Underground stations do not affect life expectancy. But one has a clear sense that the further you travel along the line, the more social deprivation, leading to lowered life expectancy, you will encounter. And the figure of "one year" is probably a rounded version of the data ... but for the purposes of this graphical illustration, it is precise enough. Someone has found a way to present information, which is of use to planners, in a way that is easy to take in. So we can learn from the example.
But, as usual, the story above is only part of the story. The statistic has been created by using limited information and extending it. The data which had been used said that the life expectancy for residents near Westminster station was seven years more than that for people living near Canning Town. They are eight stations apart. Nobody has written abot the life expectancy at those intermediate stations. All that has been done is to draw a straight line between the two extremes and assume linearity. Even though the method is not rigorous, it is still graphic. How can we learn to strike a balance between rigour and clarity?
Monday, 9 November 2009
Optimising a sound system
A curious story came my way, which is a piece of optimisation which has never been (and probably never will be) written up as an academic paper. But that's true of much applied O.R. all the time. Even academics who need to publish find that some of their studies are simply unpublishable. The story came from Dustin Curtis' blog.
He described meeting a sound engineer who set up ambient sound systems for Walt Disney World. Here's an extract:
In the mid 1990’s, the park started researching the problem. It would eventually find no existing solution, so the engineers had to design and construct, on their own, one of the most complex and advanced audio systems ever built. The work paid off: today, as you walk through Disney World, the volume of the ambient music does not change. Ever. More than 15,000 speakers have been positioned using complex algorithms to ensure that the sound plays within a range of just a couple decibels throughout the entire park. It is quite a technical feat acoustically, electrically, and mathematically.
Just think what O.R. tools would be needed for that sort of optimisation and design!
Monday, 19 October 2009
Smeaton's Tower

On 16th October 1759, Smeaton's lighthouse on the Eddystone Rocks (14 miles out of Plymouth) was illuminated for the first time. The original lighthouse has been dismantled and re-erected on Plymouth Hoe.
To mark the anniversary of this pioneering building, it was illuminated by candle-power once again on the evening of 16th October 2009.

The lighthouse featured on British one penny coins until 1970:

Why mention this in a blog about operational research? Logistics. 250 years ago, the lighthouse was illuminated by 24 candles. Three lighthouse keepers had the job of ensuring that these were lit all night, every night. They were dependent on supplies from the mainland, and the lighthouse was notoriously difficult to reach. Sometimes the keepers went for weeks without fresh supplies. So, here's the problem: how did the stock controllers plan for candles, food and supplies for the lighthouse? Apart from fresh fish, there were no other sources of food on the Eddystone Rocks. Sometimes the keepers were starving when boats reached them from the mainland. It makes academic models of inventory management seem ... academic.
And now for something different:
The Keeper of the Eddystone Light
My father was the keeper of the Eddystone light
And he slept with a mermaid one fine night
Out of this union there came three
A porpoise and a porgy and the other was me!
Yo ho ho, the wind blows free,
Oh for the life on the rolling sea!
One night, as I was a-trimming the glim
Singing a verse from the evening hymn
I head a voice cry out an "Ahoy!"
And there was my mother, sitting on a buoy.
Yo ho ho, the wind blows free,
Oh for the life on the rolling sea!
"Oh, what has become of my children three?"
My mother then inquired of me.
One's on exhibit as a talking fish
The other was served in a chafing dish.
Yo ho ho, the wind blows free,
Oh for the life on the rolling sea!
Then the phosphorus flashed in her seaweed hair.
I looked again, and my mother wasn't there
But her voice came angrily out of the night
"To Hell with the keeper of the Eddystone Light!"
Yo ho ho, the wind blows free,
Oh for the life on the rolling sea!
by: Charles Wingate
Wednesday, 9 September 2009
How many items make a pack? part 3
Two more odd sized packs for the record.
Tesco supermarket is selling packs of Broccoli with a nominal 335gm ... why? .. so they can sll them at 50p each and display a price of £1.50 per kilo!
A mail order company offered me packs of paper hand wipes (see part 2) with 260 in a pack.
Tesco supermarket is selling packs of Broccoli with a nominal 335gm ... why? .. so they can sll them at 50p each and display a price of £1.50 per kilo!
A mail order company offered me packs of paper hand wipes (see part 2) with 260 in a pack.
Tuesday, 1 September 2009
How many items make a pack? part 2
Today I gave blood (it was, according to the records, my 66th time). The UK blood donation service collects a donation of 470ml. Why 470? I asked, being an Elephant's Child with insatiable curiosity (or "'satiable curtiosity" as Kipling wrote).
The service decided on 470 because it was found to be an amount that a healthy donor of minimum weight can safely give; if it were to be increased, then it would prevent some donors from giving. If it were reduced, then handling it (because each donation is divided into parts) might become difficult. So it is 470ml (or equivalent because it is weighed) for good reasons.
Monday, 24 August 2009
How many items make a pack?
From time to time, I observe a package or a product in a shop or elsewhere, and wonder why the manufacturers have selected a particular size or number of items.
On my website, there are pictures from the ROCARO conference in Niamey in 2004, including a picture of a beer bottle holding 48cc. Why 48?
The paper towels in the washroom here come in packs of 180 towels. Why 180?
British food packaging is plagued with anomalous sizes. Jam, marmalade and numerous other items are sold in packs weighing 454gm or 340gm (equivalent to 1 pound, or 12 ounces). Flour is sold in bags weighing 1.5kg -- a reminder that it was formerly sold in bags weighing 3 pounds (why 3?)
For the final consumer, these assorted sizes are little more than an irritant; but within a supply chain, they can be more serious.
Now I shall start to collect and report odd-sized packs.
More about psychology
It is salutary to remember that the second world war, which had such an influence on my childhood, is now studied as "history" at schools. Although I was born several years afterwards, the war was sufficiently recent to affect me in various ways. Added to the change in "distance" is the change in technology and communication.
It was natural for my training in O.R. to begin with a little of the background to O.R. from WW2; we were all peers, in the sense that we had grown up with family experiences from parents and relatives of the horrors of that conflict. And our lecturers on the postgraduate O.R. programme had either experienced the pioneering wartime years of O.R., or had been mentored by those who had been involved. One of the first case-studies we heard about was the classic of "O.R. against the U-boat".
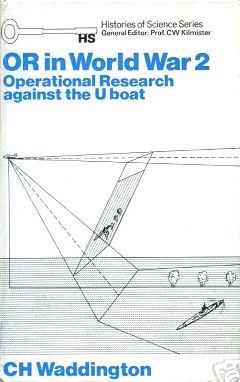
(The O.R. pioneers had been asked to try an improve the success of depth charges used against enemy submarines. The main numerical control in a depth charge is the depth at which the explosive is triggered, by the pressure of water. Until O.R. was brought in, the calculations assumed that a submarine dived immediately at the time it was sighted by the approaching aircraft. Therefore the depth was set at about 150 feet. The O.R. team convinced the military that the deth should be set much less, since submarines did not dive as quickly as had been assumed, and the accuracy of the aircraft was greater for a submarine that remained visible for longer. Suffice it to say that the "success" rate increased. This is pictured on the cover of an out-of-print book.)
I was reminded of this story last week when I noticed a copy of a book about the WW2 battle against U-boats for sale as an unwanted book in the city library. It was written from the point of view of a naval historian, and I spent a few minutes looking to see whether there was any mention of O.R. and its place. Yes, O.R. was mentioned in two places. The first retold the story of the depth charges. The second was non-mathematical. It was the psychology of spotting an aircraft. And the O.R. group were credited with the idea that the underside of the attacking aircraft should be painted white, which would camouflage them against the sky. The O.R. people analysed the results afterwards and demonstrated that this simple measure increased the success rate by a further 30%.
Reflecting on these stories over the last few days, I wondered about two aspects of these stories.
First, how much do we encourage our fellow O.R. scientists to think about psychology and human behaviour?
Second, what are the stories of O.R. success that we can use to enthuse the next generation of O.R. people?
(In the latter context, I have used the success of airline O.R. groups in rescheduling U.S. flights after the atrocities of 9/11, and the role of O.R. in scheduling public transport for the Olympic Games in Beijing.)
It was natural for my training in O.R. to begin with a little of the background to O.R. from WW2; we were all peers, in the sense that we had grown up with family experiences from parents and relatives of the horrors of that conflict. And our lecturers on the postgraduate O.R. programme had either experienced the pioneering wartime years of O.R., or had been mentored by those who had been involved. One of the first case-studies we heard about was the classic of "O.R. against the U-boat".
(The O.R. pioneers had been asked to try an improve the success of depth charges used against enemy submarines. The main numerical control in a depth charge is the depth at which the explosive is triggered, by the pressure of water. Until O.R. was brought in, the calculations assumed that a submarine dived immediately at the time it was sighted by the approaching aircraft. Therefore the depth was set at about 150 feet. The O.R. team convinced the military that the deth should be set much less, since submarines did not dive as quickly as had been assumed, and the accuracy of the aircraft was greater for a submarine that remained visible for longer. Suffice it to say that the "success" rate increased. This is pictured on the cover of an out-of-print book.)
I was reminded of this story last week when I noticed a copy of a book about the WW2 battle against U-boats for sale as an unwanted book in the city library. It was written from the point of view of a naval historian, and I spent a few minutes looking to see whether there was any mention of O.R. and its place. Yes, O.R. was mentioned in two places. The first retold the story of the depth charges. The second was non-mathematical. It was the psychology of spotting an aircraft. And the O.R. group were credited with the idea that the underside of the attacking aircraft should be painted white, which would camouflage them against the sky. The O.R. people analysed the results afterwards and demonstrated that this simple measure increased the success rate by a further 30%.
Reflecting on these stories over the last few days, I wondered about two aspects of these stories.
First, how much do we encourage our fellow O.R. scientists to think about psychology and human behaviour?
Second, what are the stories of O.R. success that we can use to enthuse the next generation of O.R. people?
(In the latter context, I have used the success of airline O.R. groups in rescheduling U.S. flights after the atrocities of 9/11, and the role of O.R. in scheduling public transport for the Olympic Games in Beijing.)
Monday, 17 August 2009
Football Statistics
I confess that I do not follow fotball particularly closely, but a column in the Independent on Saturday 15th August caught my eye. It was headed "The Statistics" and below were two bar charts that showed: (1) Points won by champions; (2) Points required to stay up. The two recorded time series are for the last 17 seasons.
I have just run regressions on these (sad, but there seemed to be a time trend) and discovered that the number of points needed to stay up is getting smaller at a statistically significant rate. Now this is curious, as there would seem to be no real reason for such a trend. It cannot continue for ever. But, of course, there is a simple trap that the data led into. The reason that there appeared to be a time trend was that the first three years were all high, and of course, they influenced the regression line. Remove those three outliers and then there is no trend. A caveat for the careless analyst.
I have just run regressions on these (sad, but there seemed to be a time trend) and discovered that the number of points needed to stay up is getting smaller at a statistically significant rate. Now this is curious, as there would seem to be no real reason for such a trend. It cannot continue for ever. But, of course, there is a simple trap that the data led into. The reason that there appeared to be a time trend was that the first three years were all high, and of course, they influenced the regression line. Remove those three outliers and then there is no trend. A caveat for the careless analyst.
OR Insight
I have just received the latest (September 2009, 22:3) issue of the journal OR Insight, one of the OR Society's regular publications. I'm interested because it has an article that I wrote, the first which has appeared in this journal.
OR Insight aims to promote Operational Research in action, with a serious emphasis on the application area. Since the start of the year, a new editorial team has been in charge and they have been determined to get good quality reports of the nature of modelling and tackling problems with OR. (So why did my paper get in!)
My paper discusses the phenomenon of "Open Studios" as a means of promoting the creative arts in the UK and elsewhere. I tackled it from an OR perspective, and as such I think it is the first paper in the area. I wrote for OR Insight because I wanted to tell a story, and this seemed the best journal for that type of paper.
But there are three other excellent papers, each telling a story of a study and the modelling which went with it.
The first considers one of the difficulties of modern life - home deliveries from mail order companies and similar. If you are out when the delivery van arrives, what happens to your package? Fraser McLeod and Tom Cherrett model one option, that customers should go to a central collection point; they look at the environmental impact of that scenario.
The second looks at health care provision of transport. The perspective is focussed on the patient (in contrast to the the apparent manager-centred perspctive often met in OR studies). The authors (David Bamford, Helen Thornton and James Bamford) conclude with two penetrating questions: "What went well?"; "What could we have done better?" Maybe those should be asked at the end of more OR studies!
And the third, by Gary Graham and John Hill, looks at the regional newspaper industry in the 21st century, and the relationship between print and electronic media. The internet is creating value for the newspaper industry, even though sales of regional newspapers are falling slowly in the UK.
Go get a copy!
Wednesday, 15 July 2009
Mathematical language in the news
When I heard one of the reporters on BBC radio 4's early news programme saying "X will be a subset of Y" today, the words grabbed my attention. Hearing the language of mathematics used in such a context is unusual. The story concerned the UK government's plans to be "Greener" and the reporter actually said:
"UK economic policy will be a subset of green planning".
To mathematicians, subsets are well defined, so all of X will be in Y; there may be items of Y that are not in X, but no items of X will be outside Y. The implication is that all UK financial planning will have to be seen as part of the desire to preserve the environment. As an O.R. person, it is interetsing to see that politicians are recognising that the "System" in which they plan has enormous boundaries. That must be forthe good.
But I don't foresee the Government's chief economist being replaced by an environmentalist for a little while yet.
More on the "Diet Problem"
I have discovered that my Excel spreadsheets for the diet problem are still online.
The Macdonald's diet problem with UK date is at:
http://www.secamlocal.ex.ac.uk/people/staff/DKSmith/BigMacLP.xls
A similar problem with Fairtrade goods and wholefoods is at:
http://www.secamlocal.ex.ac.uk/people/staff/DKSmith/FairTradeCW2.xls
In each case the prices will need to be checked and updated.
Tuesday, 14 July 2009
Two sides of the "Diet Problem"
Yesterday I contributed a comment to Laura McLay's blog about Operations Research in the USA. She was considering the way that food manufacturers mark the nutritional content of their products. Here are her comments.
I wrote:
There is a similar debate going on in the UK. Our Food Standards Agency has proposed a “traffic light” system showing that certain ingredients are low, medium or high. Some manufacturers have adopted the FSA system, others have refused to use it. Some supermarkets (and in the UK, the food retailing sector is dominated by a few large supermarket chains) have chosen their own systems.
It doesn’t look as if the FSA has used any OR in their research; I would have thought that OR could have helped answer the question that doesn’t really get tackled “What information will people use, and how will they use it?”.
It is possible to see some of the research reports that led to the FSA recommendations at http://www.food.gov.uk/foodlabelling/signposting/siognpostlabelresearch/alt
I was surprised at one response that said 25% of consumers always read nutritional labels. The question which led to this response was badly phrased and it looks as if the response was badly understood. Just watch the shoppers in your local shop; do 25% of them read every label?
Historians of O.R. reckon that Stigler's diet problem was one of the catalysts of the development of linear programming at the end of the 1940's ane early 1950's. I, like many academics, have used nutrition as a simple example of a medium-sized linear programming problem in my classes. Nutrition is additive, and there are one or two interesting constraints on maxima and minima of nutrients in the human diet. Some of them are straightforward, others are expressed as percentages of other nutrients. Many people (myself included) have used data from McDonald's to see if one can find a minimal cost, "Healthy" diet from that chain. [If you have never encountered this problem, then there are two twists in the modelling. The first is the obvious one that the problem really is an integer programming problem. The second is that sachets of sauce are free and contain nutrients; without constraining the number of sachets that you use in a day, the LP solution uses over 40.] The model has a variety of extensions and lessons for the class, for example, concerning shadow prices. [Apologies to those who do not know what a shadow price is; in this case, I used it as a tool to tell you what the maximum price should be for an item that is not in the diet.]
My former colleague, Alan Munford created an integrated database and optimisation tool for mixing feed for animals, who are less choosy about their diets than humans.(Incidentally, Munford's theorem states that for any random variable X, with mean \mu and variance \sigma^2, then for any value k
Probabilty (abs(X-\mu) \ge k^2\sigma^2) \le minimum of((1/k^2),1) [footnote])
My title was "Two sides of the ...". The second side is the one I alluded to in my comment on Laura's blog. People need information. There is an immense amount that you could list about any item of food. What ought to be put on the packaging of processed food? Those with the commonest allergies need to have simple, clear warnings. That is almost straightforward, though there are numerous unusual allergies whose sufferers need to peruse the whole list of ingredients. So those observations give the essentials: common allergies, list of everything. But what about the extra, general information? As I said, the FSA does not appear to have really though this one through, and there is a case for using some O.R. in answering it.
[footnote] Munford's theorem is a joke. Alan introduced it when he was teaching a class of probability, and proved Chebyshev's theorem, which has the inequality
\le (1/k^2). However all probabilities must be less than 1. A few years after this spoof was introduced, a firstyear student told Alan how excited he was to be taught by someone who had a theorem named after them; this student had been taught by one of our graduates who had swallowed the story that this result carried Alan's name.
Monday, 22 June 2009
Railways in the UK
To people in Britain born before -- say -- 1955, the name "Doctor Beeching" automatically conjures up the story of the drastic curtailing of the UK railway network. Following a study of the financial health of the UK railway system, in the early 1960's, Doctor Beeching recommended the closure of many railway branch lines and many stations on the remaining lines. From a network which connected cities, towns and villages, the network became one which connected cities and large towns. The report envisaged rail users commuting to their nearest station by car or public transport, and continuing their journey by rail. Over the years, the Beeching closures have been condemned by many people. Unfortunately, it is very difficult to reverse them; old tracks have been taken up, and the land has reverted to farmland or used for housing. Some stretches of the network have become footpaths and cycleways.
Last week, proposals were published to try and reverse some changes, by reopening lines and reinstating stations. Intriguingly, the proposals were based on a cost-benefit analysis, and the proposals were those which exceeded a threshold for the ratio of costs to benefits. So O.R. was used, at least in the financial model. Two cheers for the report! It would get three cheers, if there was evidence that the compilers had looked at the feasibility of the proposals, asking questions such as the availibility of car-parks for rail users, and whether or not timetables could be adjusted to include the new stations and lines.
Last week, proposals were published to try and reverse some changes, by reopening lines and reinstating stations. Intriguingly, the proposals were based on a cost-benefit analysis, and the proposals were those which exceeded a threshold for the ratio of costs to benefits. So O.R. was used, at least in the financial model. Two cheers for the report! It would get three cheers, if there was evidence that the compilers had looked at the feasibility of the proposals, asking questions such as the availibility of car-parks for rail users, and whether or not timetables could be adjusted to include the new stations and lines.
Digital Britain
Last week the UK government launched a programme based on a report titled "Digital Britain". The aim is to develop the electronic infrastructure of the UK in the next decade or so. The news media have homed in on three proposals from the many (an executive summary of 30 pages seems to go against the desire to be concise). One relates to the funding of the national broadcasting services (BBC), one to the funding of the national broadband network (so every home can have 2MBps broadband by 2012) and the third to the desire to move many FM radio transmissions to Digital by 2015.
Let's look at the second and third from an OR perspective. The proposed funding scheme is a tax of £6 per year on each telephone landline in the UK. (It's not clear if this will be applied pro rata for businesses with internal exchanges.) The media have questioned why such a tax is needed. The government scenario is that the objective of extending the broadband service can only be done by government intervention. An alternative scenario is that commercial operators will develop the broadband provision in response to demand and their financial objectives. So far the operators have done very well without the need for taxes to help. And with the increasing convergence of computer technology and telephone technology, is the scenario seen by the government the correct one?
The third proposal is intriguing. Digital radio in the uK is often referred to as DAB-radio. The government argues that the cost of upgrading the FM network will be about £200million, and this is not worthwhile. Instead, they are looking to manufacturers to develop radios that cost less than £20. So, instead of spending £200million, consumers are expected to replace their radios. Currently, our home has 7 FM radios, plus one in the car. All of these have other functions -- a radio alarm, radios with CD players, an MP3 player with FM radio. So, to replace these will cost rather more than £20 each; unlike TV sets which often have a limited life, radios go on and on and on. Of our 7 household radios, I expect 5 or 6 to be in working order in 2015. Is the scenario of scrapping them a good one? I don't think so.
Finally, the report was launched with a triumphant "We want the UK to be the best in Europe or the world". What about helping other countries to develop in their use of technology? Do we selfishly optimise our bit of the system, or do we think globally and optimise the whole? I favour thinking globally, even if it means that the UK infrastructure is not quite the best in the world!
Monday, 1 June 2009
How not to display data
In an earlier blog, I quoted one of my email signatures which uses the following quotation:
In the information age, somebody has to specialize in the development and presentation of really useful information. Doing that for management and decision-making applications is the core role of Operational Research scientists. (Randy Robinson, the first executive director of INFORMS)
Ever since I read the books "The Use and Abuse of Statistics" and "How to Lie with Statistics" I have been alert to examples of poor communication of data. Today's example comes, I am afraid, from my own university (Exeter).
Here is a map showing the modes of transport used by a sample of employees of the university. I am not sure whether to point the finger at the university or Devon County Council. So what's wrong? A few thoughts to start with.
1) The map covers far too great an area; there should be enlargements around Exeter.
2) The symbols are horrible. A black parenthesis on top of a coloured exclamation mark.
3) When you magnify the map to see the detail (and in most cases, to see the colour) then the symbols are lost.
4) What is the point? Is it to inform?
Let's be positive: could the information be presented in a different way? Suppose that we separated the modes of transport to see where the walkers come from. And those who use public transport? And those who car share? And those who travel less than 2 miles by car? The maps for many of these could be on a large scale. Then we might apply some contours of equal travelling time. But we still haven't answered the question "what is the point?"
Wednesday, 27 May 2009
Measuring and comparing risks
Yesterday's newspaper had a feature about the risks associated with competing in a triathlon. A study presented to the American College of Cardiology Conference had reported that the death rate among competitors in triathlons was about twice that of competitors in marathons. (1.5 per 100,000 competitors compared with 0.8). That news report closed with the comment from one of the staff at my university that the idea that exercise is dangerous should be compared with sedentary life.
O.R. professionals ought to be able to see through the nonsense of the report and the comment. What are you trying to measure? How do you compare one activity with another? The death rate in the U.K. is about 1 per 100 per year, or 1000 per 100,000. Dividing that by 365 and then by 8, we get 0.35 per 100,000 in a three hour period. So the death rate in marathons (which last 3 to 4 hours for the majority of competitors) is about twice the national death rate. But the rate varies with age and gender and lifestyle. However, the national death rate includes deaths from accidents, which generally affect the more mobile sectors of the population. The people who die outside marathons include the terminally ill, the aged, etc. -- not the sort of people who compete in endurance sport. They probably have an extremely small chance of dying of natural causes in the next three hours. But they have that risk of accident. So we can conclude that the person who decides to enter an endurance sport increases their chance of dying during that event. But the actual risk is still very small; the half-marathon that I mentioned earlier has about 2500 competitors. If the figures for marathons and half-marathons are comparable, there will be an avaerage of one death every fifty years.
But, even more seriously, the reports about when the deaths occur in triathlons, as all but one of those recorded were in the swimming sport, should alert organisers to warn the competitors about the risks of not being prepared for a long, frantic swim in water that is colder than in heated swimming pools.
As for me, I shall cycle home today. My risk of an accident is about 1 in 4000 based on an average of 1 accidents per ten thousand person miles (here) and a journey of 2.5 miles home. (This is about my experience -- I have been hospitalised three times in 40 years of cycling, with an average annual mileage of a little over 1000 miles, giving 3 accidents in 40,000 miles.)
Monday, 18 May 2009
Displaying data provocatively
For many years, I have been interested in the potential for using O.R. in developing countries. By a process of serendipity, I have just discovered Gapminder, where data about the world's nations are shown in original and challenging ways. I wish that I had discovered the site before now!
Wednesday, 13 May 2009
Spreadsheets and O.R.

The journal Interfaces from the U.S. O.R. Society (INFORMS) is one that I have always enjoyed reading. It describes itself as the "Journal on the Practice of Operations Research" and has often published detailed descriptions of case studies. Older members of the O.R. community will recall that for many years it was edited by Gene Woolsey, and he contributed anecdotes about his practical experience; it wasn't always the received wisdom of O.R. academics, but it was based on genuine experience of getting ones hands dirty doing our discipline.
The March-April 2009 issue of Interfaces has arrived (it takes time to cross the Atlantic) and includes an article "How Electronic Spreadsheets Changed the World" (Rick Hesse and Deborah Hesse Scerno). There was a great deal to which I could relate, as we ran a spreadsheet modelling course in the degree programme in Mathematical Statistics and O.R. at Exeter University. (From the launch of the programme, we taught students to write simple programs in Fortran, then Pascal, Simula and Smalltalk. I recall telling applicants that we expected them to use computers as a tool to help them solve problems, so we stressed a thoughtful approach to programming, and the willingness to use computer packages sensibly.)
Spreadsheets came on the scene in the 1980's -- and provided many companies and individuals with a reason for buying a personal computer. Then spreadsheets were used in schools, with the result that university entrants and others joining the job market had a basic knowledge, often of Excel. But that basic knowledge did not extend to much model-building. We found that we needed to share ideas from computer programming with students in order to help them build appropriate models. As the article emphasises, spreadsheets are wonderful -- used in the right fashion. And O.R. people need to recognise that their fashion is different from that of other professionals, and so their spreadsheet skill set needs to be honed suitably. And that takes time!
Tuesday, 5 May 2009
Running a sponge station
Google can't find the expression "Running a sponge station", so this is a first!
On Sunday 3rd May, our church ran a sponge station for the Great West Run, which is Exeter's half marathon. You can see our church at 1:41 on the video, and just glimpse some of our sponge station roadies in the next two seconds.
Our job was to hand out damp sponges to runners as they passed, and we were equipped with cheap sponges, bins for water, tabards to wear. After that, we were on our own. With experience from 2008, we had buckets and large jars for water as well, and the church tap was running continuously to refill the bins. We needed a team to collect discarded sponges, which were then washed (my job) and returned for reuse as the runners passed the church four times!
There is an assignment problem here, dealing with the varied jobs that need to be done; moving water, collecting sponges, washing, handing out. Unfortunately, it is a messy problem to solve. I don't know the skills of the volunteers, and the demands on the team in fiture will depend on the weather! So, like so many messy problems, it was solved dynamically, as each of us who could transferred between tasks as required.
At the end, we had shown God's love for the community.
Celebrations!
Not much about O.R. today. It has been the Bank Holiday weekend in the U.K., but for Tina and myself, it has been our wedding anniversary party. We celebrated 33.3333 years since we got married on an overcast day in December 1975. We decided to mark one third of a century for several reasons, but most imporatnat, it moved the anniversary to late spring, and, hoepfully, good weather, and the opportunity for friends to travel to be with us.
On Friday evening, our church hosted a concert by the Exmouth Town Concert Band in aid of charity, and we had requested two items which had been played at our ceremony. The first was the theme from the film "The Dambusters", the second was Grieg's "Morning" from the Peer Gynt Suites. Our ceremony included a hymn written in the early 1970's to be sung to the film tune, but it was not well known then. So John, our organist, included it in the voluntary before the service. We heard later that many in the congregation had expressions on their faces showing their gradual recognition of the tune, and also their surprise at its use in the voluntary. Later, those faces showed even more surprise as our guests realised that they were going to sing to that music. We wish we had had eyes in the backs of our heads to see the congregation. John had also suggested, wisely, that the music before the service should be selected by myself and Tina's mother, as Tina herself would not be there to hear it!
On Saturday we hosted a party in the garden for about 60 friends and family. The sun shone, the food and drink were there in plenty, and everyone seemed to enjoy themselves. Thanks to my brothers, sisters-in-law and nephew, Tina and I were free to circulate. In my welcome, I realised that the most appropriate word to describe the fact that everyone knew us, but nobody else knew everyone else, was the mathematical term intersection -- so I used it! Apart from that, the only O.R. related part of the day was the need to schedule the preparations of garden, food and ourselves, and that had to be done dynamically!
One unexpected aspect of such a gathering was the way that several people had known us very closely at different times in our lives and in different circumstances, and such people had the opportunity to share their memories with others. So a friend from undergraduate days discovered how different I had seemed when I embarked on a postgraduate course at a different university, and friends from Exeter discovered varied aspects of our lives.
Then we had a small, intimate supper for family and one couple whose love and support has meant a great deal to us over more than 33.3333 years.
Tuesday, 28 April 2009
Nappies, Diapers and decisions
From time to time, someone in the media raises the question "is it better to use disposable nappies (diapers) or cloth ones?" As Tina and I are childless, we have not had to face this problem in person. However, the debate about the answer is a classic case (as in Operational Research) of identifying the system in which you have defined the problem. The family is isolated from the problem of waste disposal, and concentrates on the costs and time needed for using either cloth or disposable. The waste disposal contractor (often local government in the UK) is concerned about the cost of landfill and is not bothered about the family. Society is concerned (ideally) with the total impact of a baby's lifetime in nappies. In the developed world, the option seen in Africa and Asia of letting the child run around without any nappy does not exist.
The speaker on local radio yesterday was a waste disposal person, and from his position, cloth nappies are best. But that is simply to look at the subsystem. According to several websites, and written reports, the choice is too close to call. Cotton growing, manufacture and then washing of soiled items, cause so much environmental impact that it matches the impact of disposable nappies in landfill. I haven't seen this in the O.R. literature.
Coincidentally, the book that I am currently reading (Hungry City: How Food Shapes Our Lives by Carolyn Steel) alludes to a problem which I have not seen in the reasoned discussion of the choice. How easy is it to dry a lot of nappies in a small modern British house or flat? Carolyn Steel raised the question of modern homes which are designed with minimal space in the kitchen, and British building regulations allow construction of houses with very limited floor area. So I wonder whether the answer to the question depends on how big your home is? There's a research area!
Wednesday, 22 April 2009
The secretary problem, and ants
An article has appeared online today in a leading biology journal (Proceedings of the Royal SOciety Series B) about the behaviour of ants, choosing their nesting sites. For an abstract go here.
One of the authors' keywords (why do we speak of keywords when there may be two or more?) is "Sequential search" and that links to several O.R. models for decision making. The best known is the "Secretary problem" where an employer interviews a succession of candidates for a job, and after each interview must say "yes" or "no". The aim is to find the best, or to maximise the rated value of the one selected, or to maximise the probability that the best has been chosen, or .... And it seems to me that the ants in the research paper are solving their own "secretary problem" because the authors report that very few ants in a colony go back to a nest site that they have rejected. It is not the first time that biologists have observed sequential search in living creatures; it happens with birds looking for mates, and selecting nest sites. Long before Richard Bellman, ants and birds were solving dynamic programming problems!
I admit to having a soft spot for the secretary problem. An article that I wrote for an mathematics website for schools is probably the one which has been read by more people around the world than any of my other publications.
Tuesday, 21 April 2009
Psychology and swimming pool management
In my blog of 10 June 2008, I commented on the introduction of free swimming in the UK for over-60s. Then I asked whether there had been any modelling of the likely effects; no answer yet! But the scheme has started, and the swimming pool in Exeter (Pyramids) has adopted an interesting policy to restrict the take up. It is a sort of rationing. The management has to record the number of "free" users. There is also a fear that, as Devon is a holiday destination, there will be significant numbers of users from outside the city and county during the holidays. (This is a genuine fear, as the take-up of free bus travel for the over 60s has been considerable in the holiday areas of the UK.)
So, the pool has a policy that over-60s must register and pay a small fee (£2) for a card; once this has been done, then swimming at that pool is free. Using the swipe card allows a record to be kept of usage. The fee is very small (less than the price of one entry to the swimming pool) but I suspect that the psychology of having to pay even such a small fee will be enough to deter some holiday-makers. A very subtle way of reducing demand, generating a small bit of profit on the scheme, and maintaining records.
So, the pool has a policy that over-60s must register and pay a small fee (£2) for a card; once this has been done, then swimming at that pool is free. Using the swipe card allows a record to be kept of usage. The fee is very small (less than the price of one entry to the swimming pool) but I suspect that the psychology of having to pay even such a small fee will be enough to deter some holiday-makers. A very subtle way of reducing demand, generating a small bit of profit on the scheme, and maintaining records.
Monday, 20 April 2009
Lessons for O.R. from the primary school
The same article in "The Independent" mentioned the primary school at St Ives; there was a thought-provoking quote from its head teacher (Joanne Dean) too. She too stressed the need for lifelong learning for everyone (including the O.R. profession!).
We never think to ourselves:
"That's it; I have learnt all I need to know."
It never happens
We never think to ourselves:
"That's it; I have learnt all I need to know."
It never happens
Lessons for O.R. from the junior school
Britain's "The Independent" daily paper carries a supplement on education most weeks. Last Thursday (16th April) there was a page about two schools in St Ives, Cornwall. Although St Ives is a popular holiday destination, many local people are not well off, as tourism is low paid, seasonal work. The Junior School had problems when it was inspected in about 2003, and the head teacher, Sue Smith (no relation) was drafted in to sort things out. The feature covered many of her achievements and philosophy.
Two quotes struck me as being relevant to the O.R. profession. First, a homily from her office wall:
In times of change, the learners will inherit the earth whilst the knowers will be beautifully equipped to deal with a world which no longer exists.
Second, the response to Sue Smith's question at the start of school assembly, "What are we doing?":
We are thinking, looking, listening, not talking, and concentrating.
Why the relevance to O.R.? For the first one, it is a reminder that learning never stops; as O.R. professionals, we are agents of change in systems, and that rebounds on us -- we need to be people who learn and change in turn. And for the second, those five characteristics should be the ones we show when we face a new management problem; maybe the fourth is not so relevant, and might be replaced by "Not talking irrelevantly".
Tuesday, 14 April 2009
Travels in a mathematical world
Throughout my career in O.R., I have had a dilemma about the role of mathematics in what I do. When I talk to other people on a casual, friend to friend basis, I often say that I do mathematics, and immediately add that I do the "Interesting stuff, the stuff with everyday applications". When I talk to clients or those sponsoring projects, I may talk about modelling. With students, I will talk about the mathematics that lies behind models, but will stress that these models need to be appropriate, easy to understand, and applied with political and psychological insights. As has been said many times, "A manager would rather live with a problem s/he can't solve than a solution s/he can't understand".
So I am not sure whether or not I ought to be recommending the website:
www.travelsinamathematicalworld.co.uk. It has accounts of careers in mathematical areas, as part of a process of making information about these available to a wide readership or listeners to podcasts. I came across the account by Professor Mike Maher, whose title is Professor of the Mathematical Analysis of Transport Systems at the (UK) University of Leeds. He describes the use of O.R. models in several areas of transport, mainly traffic assignment. He concludes:
"The skills that I enjoy employing are modelling skills - taking a real-world problem, and trying to formulate it as s mathematical problem with sufficient realism that the outputs can be taken seriously but simply enough to stand a chance of solving it. Then formulating some method, an algorithm, by which the problem can be solved efficiently and robustly. And in the field of transport, there is no shortage of problems!"
Isn't that what O.R. is about? Especially, I hope, "enjoyment".
The two-envelope paradox
Over the weekend, I received an email from Moshe Sniedovich in Melbourne. He will probably be flattered to be described as one of the world's outstanding O.R. scientists, but that is my opinion. His great strength is to be able to look at accepted wisdom and question it, taking what is sometimes described as "A sideways look". Anyway, his email alerted me to his developing web directory entitled "Decision-Making Under Severe Uncertainty". The URL is
decision-making.moshe-online.com
It is well worth browsing through, especially if (like me) you have a streak of skepticism at the pronouncements of experts.
Today I browsed the article he has written about the two-envelope paradox.
I have just left on your desk two indistinguishable envelopes, each con-
taining some money. I do not know how much money is involved, except
that one envelope contains exactly twice as much as the other.
You can select an envelope, open it, and either keep the money you find
in it – no questions asked – or swap envelopes and keep the money you
find in the other envelope, in which case the money in the first envelope
that you opened will self-destruct.
What should you do? According to the paradoxical analysis, you should always swap, as this will increase the expected amount you will gain. But, in a delightful essay/paper, Moshe explains the mathematics behind this situation. Enjoy!
Friday, 27 March 2009
The coin machine problem
Yesterday I saw inside a new machine and realised that its designers had solved an interesting multicriteria problem.
Many British supermarkets have introduced self-service checkouts; the shopper brings their basket to the machine, scans the items one by one without the need for a cashier, and pays by card or by cash at the end. I use one such supermarket regularly when buying a few items, because it is generally quicker than queueing for a cashier. As I have used it, I have been interested in the algorithm it follows for giving change for cash purchases. The first part of the algorithm is straightforward; if your bill is for P pence, then as soon as you have inserted any sum greater than P, the machine gives change. (So if you want to get rid of small change, then you must put that small change in before the larger coins.) But the second part concerns the coins that are dispensed as change.
British coins have values 1, 2, 5, 10, 20, 50, 100 and 200 (pence). My change has never included coins of value 2, 50 or 200. 9 pence in change is dispensed as four 1s and one 5. 90 pence in change is dispensed as one 10 and four 20s. So when I found staff maintaining one of the machines, I stopped to look (probably being labelled by the CCTV operators as a suspicious character). There were six storage receptacles for coins to be given as change, labelled 1, 5, 10, 20, 100, 100. So there is no way that I could be given a 2, a 50 or a 200.
The designers needed a design that worked with an algorithm. Have a stock of coins to give change in a logical way, and keep that stock inside a small volume. So they eliminated three coins from inclusion. So, objective 1: Be able to give change; objective 2: keep the number of storage bins to a logical minimum. But there was a subtle objective 3: use coins of small volume, to maximise the number of coins in the machine.
2 pence coins are larger in volume than those of value 1, 5, 10 and 20. 50 pence coins are larger than 2 pence. 200 pence (2 pound) coins are very large. So these were the coins to remove from the machine's design.
Now, was this design a multicriteria O.R. problem, or not? I think it was -- even if it has a solution that will not shake the world! But it does make the world a little better.
Tuesday, 24 March 2009
Precisely how do you measure?
I am reading a book with an intriguing title. "How round is your circle?" which discusses measurement and engineering mathematics (among much else). The authors point out that experimental science progressed in step with the ability to make accurate measurements. This was especially the case in astronomy, which in turn led to Newton's laws and the law of gravity being demonstrated.
I have mentioned my concern about over-precision in measurement in other blogs. Recently, Exeter, where I live, has erected signposts for the benefit of pedestrians. Distances are measured in time. This is a method often used, but is prone to abuse and error. Jokes abound about the hotel that is "two minutes from the beach" (provided you are an Olympic runner and there is no traffic in the streets), or the house for sale that is "ten minutes drive from the city centre" (when there is no other traffic, you ignore speed limits and stop signs). The problem with some of Exeter's distances is that they are too precise. One reads 19 minutes to the university campus, which is so large that it takes over 20 to cross it. There is a case for defining a set of walking times that can be used, to allow for the variation in pace, and the problem of where do you measure to. What do you think the set should be: 1,2,3,4,5,8,10,15,20,25,30,40?
I have mentioned my concern about over-precision in measurement in other blogs. Recently, Exeter, where I live, has erected signposts for the benefit of pedestrians. Distances are measured in time. This is a method often used, but is prone to abuse and error. Jokes abound about the hotel that is "two minutes from the beach" (provided you are an Olympic runner and there is no traffic in the streets), or the house for sale that is "ten minutes drive from the city centre" (when there is no other traffic, you ignore speed limits and stop signs). The problem with some of Exeter's distances is that they are too precise. One reads 19 minutes to the university campus, which is so large that it takes over 20 to cross it. There is a case for defining a set of walking times that can be used, to allow for the variation in pace, and the problem of where do you measure to. What do you think the set should be: 1,2,3,4,5,8,10,15,20,25,30,40?
How did you get started in O.R.?
For many O.R. scientists in the U.K., the route to that career was a simple one. After a first degree (3 years) with a BSc (Bachelor of Science) or BA (Bachelor of Arts) one took a one year Master's degree as a conversion course. That one year led to an MSc or MA (abbreviations as above). There were several universities offering such conversion courses. Funds for the twelve months often came from a government body, a grant-giving research council. They did for me.
Over the last few years, this funding has declined. And now it is to cease altogether. The research council argues that it should fund research, not training. But the O.R. profession has depended on the conversion courses. What will happen?
It looks as if, in the short term, the courses will continue. There are overseas students who want the British training programmes. There are a few students who will borrow money to follow the course. There may be businesses who will sponsor a recent graduate through the degree, but possibly as a part-time programme.
All in all, the route that I and thousands of other U.K. O.R. profssionals have followed is about to die.
Monday, 16 March 2009
Multicriteria Decision Making
A great deal is being written in O.R. journals and related publications about the science of multiple criteria decision making (MCDM). A few days ago I experienced one of the ways that MCDM can be especially complex.
I regularly visit a university to examine the undergraduate scripts and attend meetings as part of my duties as external examiner. My hosts book me a hotel for my overnight stay. Up to now, they have booked me into one of two hotels, E and I. I have been indifferent between them.
Both are a few minutes' walk from a railway station. Both are a few minutes' walk from the offices where we meet. Both have all the facilities of a modern impersonal hotel. Both have a good breakfast bar. E is close to a nice place to eat in the evening. I has its own in-house restaurant. I have been content in each one.
But earlier this month, I was booked into a third hotel, H. H is much further from the station and the office. Being concerned for the planet, I don't want to take a taxi for a journey that takes 20 to 25 minutes on foot, so I walk. H has all the facilities of E and I, and there was a very pleasant place for an evening meal close by.
But on the criteria that I had judged E and I by, H would be less attractive. But H has a swimming pool that is large enough to have a "decent" swim. E and I do not. A new dimension has been added to the MCDM problem. And that makes the choice for me more complex. Where shall I ask to stay next time?
Of course, if I took taxis everywhere, there would be no problem. But I do not. And there's the problem of weighing the advantages of convenience against the joy of a swimming pool. No wonder MCDM is challenging!
Wednesday, 11 March 2009
Mobile telephones and development
The Independent, the national newspaper that I read daily, had an article yesterday in which Clare Rudebeck explained how the spread of ICT (and especially mobile phones) is improving the quality of life for many people in the Third World.
If you have travelled in a developing country in the last few years, and especially if you have moved from the comfort zone of a hotel, you will have seen vendors of mobile phones and SIM cards. Looking more closely, you may have seen booths where the owner of a phone rents out his phone to members of the public. The article discusses this phenomenon, and quotes Richard Heeks, Professor of Development Informatics at the University of Manchester (UK). Following that lead, I found several items in a newsletter. Operational Research contributes to these, with models of the uncertain future. But had you been forecasting development of telecommunications in sub-Saharan Africa 20 years ago, would you have believed that there would be no need for an infrastructure of fixed telephone lines? I doubt it!
If you have travelled in a developing country in the last few years, and especially if you have moved from the comfort zone of a hotel, you will have seen vendors of mobile phones and SIM cards. Looking more closely, you may have seen booths where the owner of a phone rents out his phone to members of the public. The article discusses this phenomenon, and quotes Richard Heeks, Professor of Development Informatics at the University of Manchester (UK). Following that lead, I found several items in a newsletter. Operational Research contributes to these, with models of the uncertain future. But had you been forecasting development of telecommunications in sub-Saharan Africa 20 years ago, would you have believed that there would be no need for an infrastructure of fixed telephone lines? I doubt it!
Tuesday, 3 March 2009
Spot the yield/revenue management! (2)
Another area of yield/revenue management that wasn't mentioned before is that of green fees at a golf club. High at weekends and holidays, low during the week.
Measuring the difficult
Sometimes in operational research it becomes necessary to measure something which is difficult. From time to time, the O.R. literature reports on studies which fall in this category, and it is fascinating to see how the profession tackles the problem of measuring the difficult. Statisticians have techniques for surveys which ask extremely sensitive questions.
I have just come across a paper which falls in this "Fascinating how the research measured the difficult". How do you measure people's journeys in an elevator? Here's the citation:
@ARTICLE{Fascinating,
AUTHOR ="Kiyoshi Yoneda",
TITLE ="Elevator Trip Distribution for Inconsistent Passenger Input-Output Data",
JOURNAL ="Decision Making in Manufacturing and Services",
YEAR = "2007",
volume = "1",
number = "1/2",
pages = "175--190",
note = "Fukuoka University, Fukuoka, 814-0180 JAPAN",
abstract = "Accurate traffic data are the basis for group control of elevators and its performance evaluation by trace driven simulation. The present practice estimates a time series of inter-floor passenger traffic based on commonly available elevator sensor data. The method demands that the sensor data be transformed into sets of passenger input-output data which are consistent in the sense that the transportation preserves the number of passengers. Since observation involves various behavioral assumptions, which may actually be violated, as well as measurement errors, it has been necessary to apply data adjustment procedures to secure the consistency. This paper proposes an alternative algorithm which reconstructs elevator passenger origin-destination tables from inconsistent passenger input-output data sets, thus eliminating the ad hoc data adjustment.",
file = F
}
One of my colleagues was involved in a study of what coins people would put into a slot machine that gave change, in order to determine what mix of change the machine should have. He started with a survey of the students we teach, and then asked them to repeat the survey with ten friends.
On the subject of elevators, I liked "10 Clever Elevator Ads".
Monday, 2 March 2009
The curse of the sat-nav system
In the UK, and I guess in most other countries, satellite navigation systems (sat-navs) are a blessing and a curse. Surprisingly little has been published about the design of the algorithms used in them, though essentially they use modified forms of Dijkstra's method, which is also the dynamic programming approach. A fellow blogger has commented on some of the stories from the UK, Belgium and the Netherlands.
Over a meal on Friday evening, friends were talking about stories which don't reach the national papers. They mentioned the large number of small sites for caravans (there is a club which has private use of fields in many farms) which have the warning "Do not use sat nav" in their guide-book. Another friend mentioned that a passenger ferry across a river, at the end of a lane, is marked as accessible to vehicles.
There are several problems with sat-navs that these stories highlight. Most obvious is that data can be incorrect, and once published, is hard to retract. Next is that data may change; roads can be closed for repair, and even online updates may not help, even if the user chooses to subscribe to such a facility. But from an O.R. point of view, there is the question of the wrong algorithm. Many of the problems could be dealt with if the algorithm took into account the kind of vehicle, which would mean solving a constrained shortest path problem ... and for nearly all cases, that would mean using the normal algorithm on a modified dataset. But that would increase the price of the system.
So we end up with people cursing the system, damage to property thanks to incorrectly routed vehicles, a cost to society with special road signs trying to stop vehicles routed with sat-nav ....
Designing road markings
I am someone who frequently asks the question "Why?" about the design of everyday objects, because of the interplay between design and operational research. On my way to the office today, I noticed that one of the advanced stop lines for cyclists seemed much larger than others that I encounter. So I asked myself "Why is it that size?" and then speculated about the optimal size for such a road marking.
The wonders of Google led me to a website from the UK Department for Transport, which says that the "cycle reservoir should be between 4m and 5m in depth. If the reservoir is shallower than this cyclists can feel intimidated by the close proximity of the vehicles queuing behind them. If the reservoir is deeper than this, motorists may feel encouraged to encroach into it." So the design is based on psychology, which links to some of my earlier blogs here. It is reassuring that someone has thought about the design and suggested guideline measurements.
So if you see me around Exeter with a 4metre tape measure, you will know that I am checking the roads!
Monday, 23 February 2009
Spot the yield/revenue management!
When I was a child, there was a very popular series of cheap books called "I spy". In each one there were about 30 to 50 items that one might see in a chosen situation. "I spy in London", "I spy in a hospital", "I spy on the railways" and so on. There were brief explanations of each item, and a point score alongside; common items scored 5 to 20 points, rarer ones might score 40 or 50. (One of the latter, I recall, was seeing a valley with river, road, railway and canal alongside each other.) There was also space to note where and when the item had been seen. The books were educational and fun; some facts were in them which I never encountered elsewhere in my education.
I am thinking that there should be a similar book for yield/revenue management. "I spy RM". Increasingly, RM enters our daily lives. The text books tell us that it was largely a product of the 1980's and airline management, but the roots of it go far further back, to hairdressers who charge different prices on different days of the week, and hotels which have weekend rates. So where can one spot RM today?
(1) Transport especially in the UK on flights and rail journeys, but there are cases of coach and bus travel;
(2) Hotels -- certainly if you Google for the topic, it is RM in hotels that comes out top, possibly because hotel management is diffused compared with the centralised management of airlines.
(3) Restaurants and other food and drink outlets
(4) Theatres and (slightly) cinemas
(5) Delivery of goods -- this encounter was what prompted me to blog today; we decided to order from a supermarket for home delivery and discovered that there were different prices for different two hour delivery slots. (We only decided to use the service because we had a £10 off voucher, which more than covered the deleivery charge at any time.)
Are there other, even rarer cases of RM?
In IAOR, the research papers are indexed under Yield Management, not RM. I have found that the expression Revenue Management is used by accountants to describe budgeting, so I prefer to use Yield.
Monday, 16 February 2009
Can the solution be implemented?
A story from the press today tells how the Paris Metro (underground rail network) has been forced to change its tickets. For over a hundred years, the Metro has used small tickets, 2inches long by 1inch wide, or probably 50 by 25 mm. Latterly these have had a magnetic stripe which is used in the automatic barriers. But the authorities have noticed that more and more often, the tickets become demagnetised while being carried by members of the public, and tickets carried by women are more likely to suffer than thse carried by men. The problem is the increasing use of magnets as clasps on handbags, magnets which are strong enough to keep the bag closed, and therefore strong enough to demagnetise a ticket. So, sometime soon, the Metro is joining other mass transport systems and using cards with RFID and chips.
There are links between this story and O.R.. First, the general one -- that the solution to an O.R. problem may have been appropriate once, but should be monitored to make sure that the setting remains the same. Hence the title of this blog: can the solution be implemented? Or are there some good reasons why the behaviour of some of the people involved has changed? Second, I hope that the O.R. team who work for the Metro have done some analysis of the time it takes to check a new-style card in order to be sure that the barriers can cope with the passengers using the system at peak times. Turnstiles are servers in a complex queue, and changes in service times affect the characteristics of the queue.
The story is here
Tuesday, 3 February 2009
Optimising the sub-system or the system?

There was heavy snow in Southern England yesterday, and there were problems with the transport infrastructure. In London, all the buses were cancelled, flights were cancelled, trains delayed, roads congested and blocked by accidents. Inevitably, some people asked the question "Why?". "Why can other countries cope with heavy snow, while England cannot?"
"Why?" is, of course, the correct question for an O.R. analyst to ask. And, I am pleased to note, there were people prepapred to give an O.R. answer. It comes down to the words of today's title. Should one optimise the system or the sub-system? For the commuter whose journey has been disrupted, the sub-system is non-optimal because he or she believes that the optimal solution is for there to be no problems with the commuter's journey. But the speaker explained that optimising the system means that it is not economic to have expensive equipment and trained staff needed for one or two days every ten years. It was a matter of costs and benefits. Naturally, the speaker didn't use these words, but they were implicit. And then the speaker added that with increasing numbers of people able to work from home, the difference between optimising the system and optimising the sub-system became even greater.
The picture is of my back garden this morning.
Monday, 2 February 2009
Commuting Behaviour
A further observation from my trip to London is how there is a great difference between the social mix of commuters on public transport between Exeter and London. In Exeter, relatively few male executives use public transport. The rail lines are reasonably busy, but few males use the buses for commuting. But in London, it is quite normal and acceptable to use public transport. Of course, the infrastructure is better, but there is a difference in psychology as well. I wondered what research had appeared about the popularity of public transport commuting in cities of varying sizes.
It is relevant to O.R. because anyone working on transport models needs to remember the acceptability and feasibility of different modes of transport in different places. Behavioural psychology has its place in operational research.
Google turned up some figures for the United States. The comments are interesting. I wonder how much correlation there is between population and these percentages? And is there a similar set of data for other countries? And are there geographical effects to take into account?
RAW DATA: PUBLIC TRANSIT USE
Top 5 Cities for Public Transit Use
- 54.63% New York, NY
- 37.72% Washington, D.C.
- 32.66% San Francisco, CA
- 31.65% Boston, MA
- 25.92% Philadelphia, PA
With the exception of Washington , D.C. , every city here grew up in the horse and buggy days, with streetcar rail systems. The District of Columbia is part of the 1960-70s "graduating class" of newly subway-enabled cities, along with Atlanta (MARTA) and San Francisco Bay Area cities San Francisco and Oakland (BART). BART reaches regional airports, commuter rail systems CalTrain, ACE and Amtrak, and someday it may even roll down to suburban San Jose . Atlanta is planning to extend MARTA with its back-to-the-future PeachTree Street Trolley and improved bus service.
Bottom 5 Cities for Public Transit Use
- 1.07% Fort Worth, TX
- 1.03% Tulsa, OK
- 0.97% Oklahoma City, OK
- 0.54% Virginia Beach, VA
- 0.40% Arlington, TX
Surprise! These southern cities would benefit from re-installing light rail systems. Adding rail would provide residents relief from high gas prices -- and improve these cities' economic competitiveness. With air-conditioning thrown in, light rail would also provide relief from summer humidity.
When should one use O.R.?
Last week I had to go up to London (why is it always "up to London"?) for a meeting. Three and a half hours in a train to get there, three hours back, and two hours in the meeting. Every time I visit the capital, I am struck by the differences between Exeter (population 110,000) and London (population 7.5 million). This time my attention was caught by the advertisements on the London Underground (OK, I should get a life!). Several stations now have adverts projected across the tracks. But, the advert which caught my eye was on the walls of the escalators, where flat panel screens have replaced some of the static adverts. The advert was for T-mobile, and featured the company's recent TV advert, of a pre-arranged, choreographed flash-dance at Liverpool Station. "Life is for sharing" was the punch line.
Back home, I found the advert in full on Youtube, and also the director's background story behind an amusing and challenging project. Having enjoyed them both, I wondered whether there would be any place in the making of the advert for O.R.. How could "The Science of Better" make the production "Better"?
I suppose that the main traditional O.R. techniques that could have been used would be forecasting and scheduling. Forecasting to make sure that there were enough resources at the right time and the right place. Scheduling to make sure that resources were used as well as they could be. But there is actually little incentive to use O.R. in such a project. Either the people were ready for the advert on the morning of January 15th 2009, or they were not. There's no 95% confidence. It is a one-off event. And there is probably the answer. The director and his team worked to a deadline, made decisions as they were necessary and used a great deal of experience and common sense. And it worked.
Maybe if the director had to make such a film every two months for the next two or three years, then there would be a place for analysis and improvement, but that is not how the advertising world works. Perhaps an analyst can offer suggestions for improvements next time ....
And the other problem with the idea of scheduling is that you are dealing with people. It is often said that many O.R. techniques work better with machines and inanimate objects than when people interact!
Tuesday, 27 January 2009
Rabbit hole day, part 2
In one of our undergraduate modules we taught ideas of inventory control, both the theory and discussion of the practice. Naturally we looked at ABC analysis, the EOQ, Wagner-Whitin and problems with constraints. Then in exercises, we asked the students to think what practical obstacles there might be in applying the models. One question asked: "How may inventory models be used by small shop-keepers?", expecting a discussion about record keeping, the cost-benefit of having some kinds of records. Instead:
The first question to be answered is what we mean by "small". Given that the mean height of males in the UK is about 5ft 8in, with standard deviation 2.5in, "small" can be taken as males whose height is below 5ft 3in. Such people need assistance to reach high shelves, and Health and Safety legislation means that they must use ladders. Therefore we recommend that small shop-keepers arrange their shelving so that those items which are A or B are kept on low shelves, and C items are kept higher up.
And so it went on ....
Rabbit hole day
It is the fifth worldwide Rabbit Hole Day. So forget about normal blogs, and think laterally.
So, some levity. There is a famous paper on the mathematical theory of big game hunting, or how to catch a lion in Africa. As it was published in 1938, before O.R. existed as a discipline, other people have added their little bit to the original: so here are three ways that O.R. people and their allies catch lions.
So, some levity. There is a famous paper on the mathematical theory of big game hunting, or how to catch a lion in Africa. As it was published in 1938, before O.R. existed as a discipline, other people have added their little bit to the original: so here are three ways that O.R. people and their allies catch lions.
==
Statisticians hunt the first animal they see N times and call it an lion.
Consultants don't hunt lions, and many have never hunted anything at all, but they can be hired by the hour to advise those people who do.
Operations research consultants can also measure the correlation of hat size and bullet color to efficiency of lion-hunting strategies, if someone else will only identify the lions.
A new page for IAOR
Yesterday I updated the webpage which advertises IAOR at the IFORS website, to reflect the change from "A printed journal with an electronic version" to "An electronic journal with a printed version". To my shame, the text that was there up until now had been written in 2002 and not brought up to date, but my excuse is that the responsibility for the web presence was not mine. But it is a reminder that webpages with dates or events need to be monitored.
The IAOR webpage will probably change again this week, as I have submitted a photograph for it.
The IAOR webpage will probably change again this week, as I have submitted a photograph for it.
Friday, 23 January 2009
Logistics in Ancient Egypt
A few years ago, I went to the inaugural address given by Exeter University's Professor of Archaeology, Professor Val Maxfield. (Her office was on the floor below mine, and I saw her several times a week as a result.) Before her lecture, I had little idea what her speciality in the subject was, and so her topic came as a surprise.
She spoke about excavations in the eastern mountains of Egypt, close to the Red Sea. There, the Romans quarried a stone called porphyry, and this was the only site in the world for this stone. (To find out more about it, go here.) But what fascinated me, as an O.R. person, was the logistics of moving the quarried stone from high in the mountains, to the Nile, and then by sea to Ostia (Rome's port) and overland from there to the city. The enterprise required extensive logistics. Engineers laid out a road that could be used to trundle the stone downhill and across the arid terrain. There were wells dug along the road. There had to be an infrastructure to house and feed the slaves who moved the stones, as well as the quarry-workers. These are skills which have been lost; today, if anyone needed to transport a ten tonne column a few hundred kilometres, then it would be done mechanically, and generally the logistics would have been simple.
I salute the logistics engineer(s) who were in charge of this enterprise.
When I discussed it with Val, she threw in two further aspects to think about. First, because sea travel was unreliable, "there are probably several shiploads of porphyry on the seabed of the Mediterranean". How disappointing for the engineers! Second, as the quarry was lost for centuries after the fall of the (western) Roman Empire, and the stone was prized in Byzantium/Constantinople/Istanbul, many of the monuments of Rome were looted and the stones taken to the capital of the Eastern Empire. Yet more logistics!
Sadly, the second century "Journal of Mining" and its published research paper: "The Logistics of Quarrying at Mons Porpyritis" is not available now.
Supply Chain management in Exodus
This year, Tina and I are reading the Bible together using a Chronological Bible, one which attempts to place the whole of the Old and New Testaments in their chronological order. Reading the whole Bible in one year is a challenge -- there are about four or five pages to read each day, and we read them aloud together after breakfast, before our family prayers.
Today we reached the account of the Children of Israel in Egypt, and Pharaoh's punishment that their slavery be made harder. They should continue making bricks for him, but they had to find their own straw (to bind the clay together). And, the word of God continues, this made their work much, much harder and their productivity fell.
It struck me that here is one of the earliest recorded instances of a supply chain and how bad management made it go wrong. Up till then, there was a supply chain of Egyptians providing straw for the Hebrews making bricks. Pharaoh's orders broke that. And it went wrong. The Bible tells the story from the production end. What happened, one wonders, about the upstream end? What happened to those whose livelihood had been based on supplying straw?
Amazingly, there are many hits when you Google with the keywords "supply chain" + exodus + straw, and one which comes up high is a Christian sermon about modern slavery ... not quite what I was thinking about, but fascinating that someone else has linked the ideas in a church. Here is that link.
The Italian Job -- a solution
The British papers this week are finding space for a few stories other than the inauguration of Barack Obama and the current credit crunch. One such is the outcome of a competition to solve the forty-year old problem of the end of the film, The Italian Job. The competition was organised by the British Royal Society of Chemistry (why not a mathematical society?). It is good to see mathematical modelling, problem solving and decision making in the news media. So here is the story, courtesy of Britain's Daily Telegraph.
===
===And for those who like puns ...
"Keep singing The Self Preservation Society," he tells the gang. The chorus starts up again until they all get frogs in their throats. The frogs start to jump up and down, which rocks the bus.
===
As cliffhanger endings go, there are few more famous than that of The Italian Job. With their coach dangling precariously over an Alpine ravine, a gang of plucky British robbers – led by Michael Caine's Charlie Croker – face the choice of saving themselves or risking all to retrieve the stash of gold they have stolen from Turin. However, each move they make towards the rear of the coach to reach their haul results in the vehicle inching further over the abyss.
The film ends with the famous words from Croker: "Hang on a minute, lads – I've got a great idea." But what was the idea – and would it have worked?
=== The winning solution -- for which the prize is a holiday in Turin, but no gold.
===
===And for those who like puns ...
"Keep singing The Self Preservation Society," he tells the gang. The chorus starts up again until they all get frogs in their throats. The frogs start to jump up and down, which rocks the bus.
They use the rocks to weigh the end of the bus. "Keep singing, lads."
They sing louder, but now the frogs have gone, their throats get sore. They use the saw to cut the gold bars in half. Two halves make a whole. They pass the gold out through the hole, and jump out.
Still singing, they've now all gone hoarse. They load the gold on to the horses and ride off into the sunset.
===
Tuesday, 20 January 2009
The paradox of optimal location
Yesterday I was talking with a former student, whose company provides statistical advice to clients in the service industry. He mentioned an interesting paradox about optimal location, in this case of ambulances. The UK government has various standards or targets to be achieved by public sector bodies, and one of these is about how quickly ambulances can reach an emergency. It's of the form: "In X% of calls, the ambulance must reach the emergency within Y minutes".
He said that in urban areas, it is relatively easy to deploy vehicles to achieve this, because of the short distances involved. And it is also reasonably easy in regions where there are several medium to large towns and cities and a scattered rural population, because the response to the cities dominates the statistics. But the targets are hard to achieve where there are many small to medium sized towns, none of which have sufficient demand to require a vehicle of their own. Then the solution leads to an excess of vehicles.
You can test this for yourself. Suppose that the district is an equilateral triangle, and the demand is such that one vehicle is needed. If the population is spread uniformly across it, then you place your vehicle at the centre of the triangle. If the population is concentrated and divided equally at the three corners, then the best place would still be the centre, but nobody lives there, and so the vehicle should be located at one of the corners. But that means that in two cases out of three, the vehicle must travel to one of the other settlements, and potentially violate the service standard.
I haven't seen this paradox mentioned anywhere in the literature, so you may have read it here first!
Monday, 19 January 2009
Marketing Crisps and Operational Research
Having mentioned crisps, my mind wandered to a recent news story about marketing with an O.R. twist. The UK crisp brand Walkers called on consumers to come up with new ideas for flavours of crisps, with the slogan "Do us a flavour". Six were identified as potentially usable: chilli and chocolate, onion bhaji, Cajun squirrel, fish and chips, crispy duck and hoi sin, and builder's breakfast. There is a public vote to determine the winning flavour which will then remain on sale.
The competition has generated a considerable amount of public interest. Walkers had originally expected about 250,000 entries into the competition, however, it actually received about 1.2m flavour suggestions.
And there is the O.R. twist. Who made the forecast? Has anyone stood up, put their hand on their heart, and admitted "Our forecast model was wrong. We were 80% below."? In the circumstances, I suspect that the forecast was more of a guess than a mathematical model, and the success, both in consumer response and free publicity, will mean that the forecasters will live to forecast for another campaign.
Marketing and Operational Research
My impressions are that in the United Kingdom, surprisingly few O.R. scientists have published papers relating to marketing. The U.S. O.R. society, INFORMS, publishes a journal devoted to quantitative marketing, but there is no comparable interest in the U.K.. Over the years, I have had one or two encounters with projects relating to some aspect of marketing, but have never got a sense that marketing departments use O.R. advice very much. Some of the projects have started with the adage "Half the money spent on advertising is wasted -- but nobody knows which half; if you knew which half, you would make a fortune."
In my postgraduate course we came across a problem which I have never seen written up, perhaps because the problem was trying to build a model to explain some anomalous data and the parameters would have been a commercial secret. So here, nearly forty years after it happened, is a summary.
For many years, the dominant company in the U.K. market for potato crisps was "Smith's". They held over half the market. Then a new bran d was launched, called Golden Wonder. Over the subsequent few months, surveys were carried out to try to measure brand awareness. The problem was that the percentage answering the question "What was the brand of crisps that you last bought?" with "GW" was far lower than the percentage market share for GW. Why?
The answer was inertia and lack of awareness of the brand. Purchasers would ask for a "packet of crisps" and since most shops (and especially bars) only stocked one brand of an item that occupied a lot of storage space, the purchasers accepted what they were given and did not associate their purchase with a brand -- and Smith's had been the leading brand for so long that the association was "Smithscrisps" as one word.
So, as students, we were asked to re-work what the consultants had done, and build a model to link the growth over time of the sales and the growth over time of the awareness. It taught us about building and fitting nonlinear models, and a little about the vagaries of our fellow humans. But it could never have been written up as a paper!
In my postgraduate course we came across a problem which I have never seen written up, perhaps because the problem was trying to build a model to explain some anomalous data and the parameters would have been a commercial secret. So here, nearly forty years after it happened, is a summary.
For many years, the dominant company in the U.K. market for potato crisps was "Smith's". They held over half the market. Then a new bran
d was launched, called Golden Wonder. Over the subsequent few months, surveys were carried out to try to measure brand awareness. The problem was that the percentage answering the question "What was the brand of crisps that you last bought?" with "GW" was far lower than the percentage market share for GW. Why? The answer was inertia and lack of awareness of the brand. Purchasers would ask for a "packet of crisps" and since most shops (and especially bars) only stocked one brand of an item that occupied a lot of storage space, the purchasers accepted what they were given and did not associate their purchase with a brand -- and Smith's had been the leading brand for so long that the association was "Smithscrisps" as one word.
So, as students, we were asked to re-work what the consultants had done, and build a model to link the growth over time of the sales and the growth over time of the awareness. It taught us about building and fitting nonlinear models, and a little about the vagaries of our fellow humans. But it could never have been written up as a paper!
Wednesday, 14 January 2009
The psychology of implementation of O.R.

It has been generally acknowledged in the O.R. that I have studied that implementing O.R. needs to recognise the psychology of the eventual user. There are numerous anecdotes and O.R. legends about this. The problem of elevators in the New York skyscraper is one of the oldest.
Office workers complained about the time they had to wait for elevators, so an O.R. team was asked to try and find an appropriate solution.
Various models were built in the investigation. These considered having more elevators, faster elevators, elevators that only stopped at particular floors. All were deemed insufficient.
Then the psychologist on the team proposed that there be full-length mirrors in the lobbies between the doors of the elevators. His argument was that these mirrors would reduce the perceived time of waiting; some people could arrange their clothing and check their hair; others could surreptitiously watch their fellow workers in the mirror. (The original story was sexist; this is the PC version.)
Result: no more complaints. The solution cost very little.
The same solution approach explains why you have magazines in waiting rooms, and automated advertising screens in bank and other queues. (Does anyone know of an airport where the queues are entertained by such screens? In those that I have visited, the queues have to watch endless reminders about what cannot be taken through security, or how to prepare for security.) And it also partly explains the popularity of glass-walled lifts, where there is something to watch while you are travelling.
(By the way, some statistics show that elevators are the safest form of transport in terms of deaths per passenger mile.)
Many years later, I came across a note about differing national psychologies. We were discussing the optimal timing of the red phase on traffic lights at a junction such as a cross roads. In heavy traffic, the throughput is maximised by having very long phases. The constraint is psychological; if the lights do not turn from red to green, those waiting at the red light start to become impatient. My informant suggested that two minutes was the limit in the UK, nearly three in the USA, and in Japan, the patient Japanese motorist only started to fret after four minutes. I'd be interested in knowing the basis for this.
O.R. in developing countries
Following on from the comments about Eritrea, my mind wandered to ask which countries have not been linked to a published O.R. paper.
According to the Traveler's Century Club there are 319 countries in the world (I'm not a member as you have to have visited one hundred or more from their list, and my tally is about sixty). The United Nations has 192 members. The International Federation of Operational Research Societies (IFORS) has "over forty five" members (it was 48 when the roll was called at the last IFORS conference, but there are a few national societies whose current existence is uncertain. So we can reckon that there is work on O.R. in those countries.
But which countries are missing?
My quick check found no O.R. papers from:
Burundi
Chad
Djibouti
Swaziland
Bhutan
Burma (Myanmar)
Kazakhstan
Laos
North Korea
Uzbekistan
from my knowledge of Africa and Asia. I would be interested if anyone can correct this list. I need to look at South America.
(My "rules" are that a paper should be about an application in the country, or which has been developed with enough data from the country to claim relevance. The "rules" do not say that the work should have been implemented.)
Tuesday, 13 January 2009
O.R. in Eritrea

When IAOR prints an abstract relating to O.R. in a developing country, it is usually cross-indexed with the name of that country. So the latest "OR in a DC" abstract marks a rare event -- it is the first that has been included (as far as my records go) about O.R. in Eritrea.
The paper is:
Cost analysis of an integrated disease surveillance and response system: case of Burkina Faso, Eritrea, and Mali
by
Zana C Somda, Martin I Meltzerl, Helen N Perryl, Nancy E Messonnier, Usman Abdulmumini, Goitom Mebrahtu, Massambou Sacko, Kandioura Toure, Salimnta Ouedraogo Ki, Tuoyo Okorosobo, Wondimagegnehu Alemu and Idrissa Sow
published in:
Cost Effectiveness and Resource Allocation 2009, 7:1doi:10.1186/1478-7547-7-1
Papers with so many authors/co-authors are also rare events.
By the way, if you don't know where Eritrea is, the map shows it in the north-east corner of Africa, bordering on the Red Sea.
Wednesday, 7 January 2009
Innumeracy
There is currently an advert on UK commercial radio which trades on people's innumeracy.
Switch from sugar to a sugar substitute and "you will save about 7000 Calories per year".
It sounds a lot, but that is les sthan 20 per day, i.e. less than 1% of the daily recommended intake.
But "Seven thousand" sounds a lot, doesn't it!
Switch from sugar to a sugar substitute and "you will save about 7000 Calories per year".
It sounds a lot, but that is les sthan 20 per day, i.e. less than 1% of the daily recommended intake.
But "Seven thousand" sounds a lot, doesn't it!
Think of the user!
Good O.R. has to be implemented. Period. Full stop.
So, at some stage, someone needs to think of the person who will use the results. The problem may have been presented by management, and the person who pays for the work is in the management hierarchy, but the person who actually uses the results is probably not in management. Which is why implementation is important.
I have linked implementation and design before, but over the Christmas holiday we had experience of both good design (implementation) and bad.
Let's start with the bad news. We bought a new set of Christmas lights to make an arch around the front door. They came with an integral control box which had one button only. Repeated pressing of the button cycled through several patterns of flashing lights, with one where all bulbs stayed on all the time. So we put the string of lights up, switched on and discovered that the default was a pattern which faded and flashed -- too garish for us. So we cycled and selected the constant selection. Then we switched off, to put the string onto a time switch. When it came on, we were back to the default. As a result, at some stage every evening, yours truly had to press the button to select our favoured setting. With a little forethought, the designer could have ensured that the setting that had been selected became the default one for the next off--on sequence ... because that is what the user had expressed a wish to show what was wanted.
The good news was that Tina was given a DAB radio. Plug it in, switch it on, and set up the controls. It was extremely easy, with clear instructions, designed with the user in mind. Full marks for those at "Pure" for thinking of the user.
Monday, 5 January 2009
O.R. and waste management2
Another slant on a topic which I referred to in August 2008
One of the responsibilities of editing the International Abstracts in Operations Research is to have an awareness of the areas of application of O.R., and especially those which lead to publications in the academic literature. Someone has said that applications of O.R. should be so good that they can be published in the literature of the application area. And that imposes a high standard for the O.R. scientist, having an ability to work within another discipline to such a high standard that ones work stands up against the peers in that discipline.
So it is interesting to notice that more and more O.R. work is being reported relating to waste management. An IAOR search in the online version produced over 240 hits for "waste AND management", running across many aspects of the subject: location of facilities, vehicle routing and scheduling, capacity planning, multicriteria models for planning a waste management programme, etc. etc.
But comparatively little of this work has appeared in the O.R. literature. It is mostly in the application area. I wonder why?
Subscribe to:
Posts (Atom)